HighChart - Bar view
This tutorial goes through how to create a Bar view using Highcharts third-party library in Omniscope.
The view would support Measure by and Split by, implement selection, use poor man’s brushing and support auto-querying and auto-paning.
For the purposes of the demo we will be using the Bond Prices embedded demo as the data source.
Step 1: Start Omniscope and create new file
Start Omniscope and create new file.
Step 2: Creating a new view
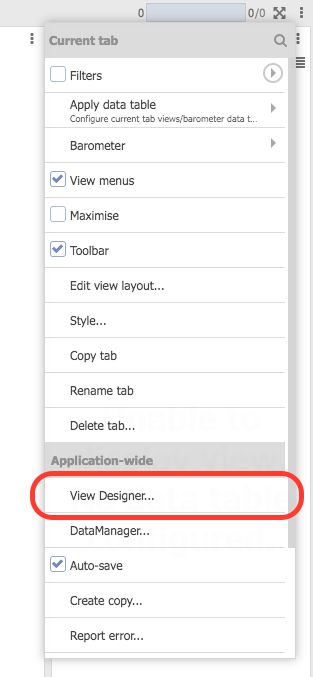
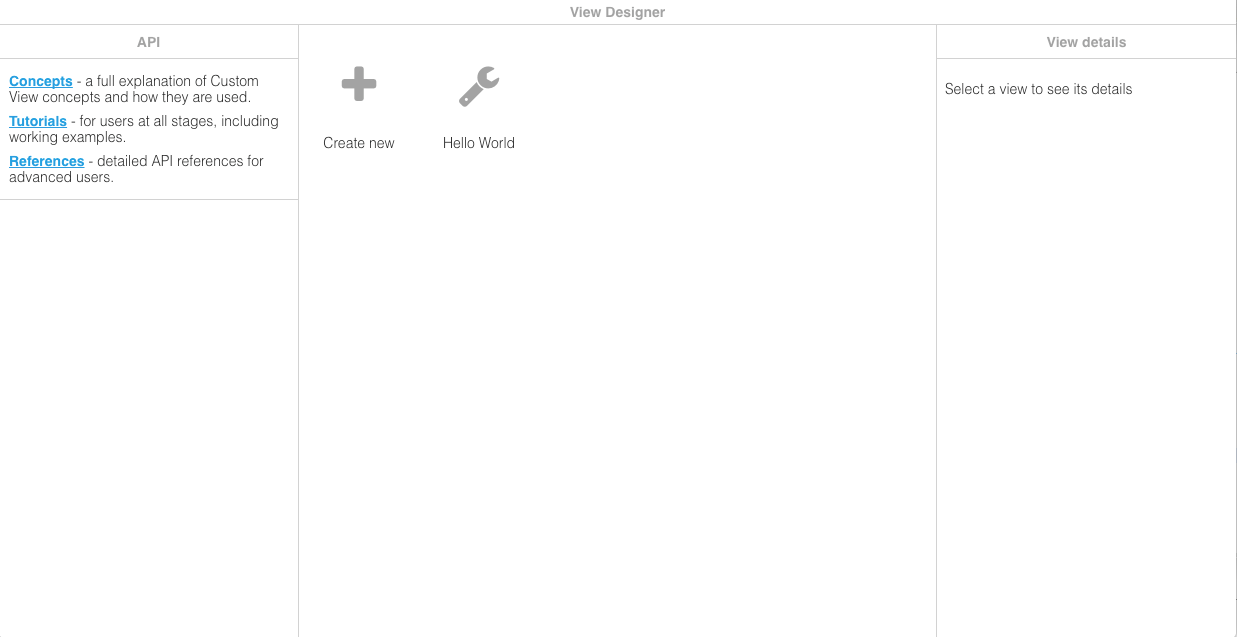
To create your view click settings button (three dots on the top right hand corner) and click “View designer…” The View designer is the user interface that allows you to create and manage your views.
This will open the View designer in an external browser. Click “Create new” and name it “Hello World”.
Note: If you change your split/measures and even change the Pane X and Y, then you should see your view updating to see view automatically update to show your the results.
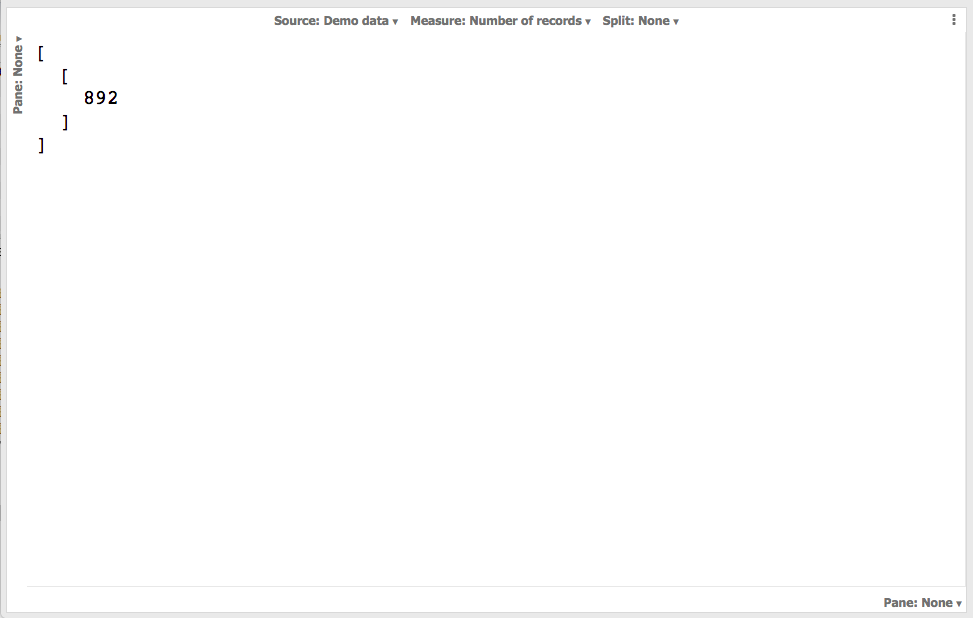
When the view has been added you should see your newly created view showing the current number of records. This is because the default index.html which is created for you, shows the auto-query results in JSON format.
We recommend you have the following workspace layout when developing your custom views. In one browser/tab depending on your preference, have the View designer in one browser/tab and View in another showing developer tools.
Once your view is open in the browser, have the developer tools continuously showing so that you can debug as you edit your index.html/manifest.json. You may need to refresh your browser page when you show developer tools to start debugging.
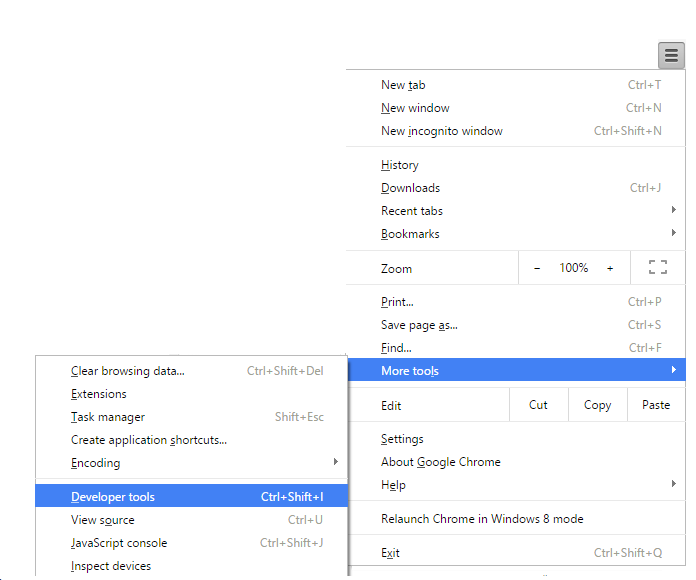
In Chrome you can access Developer tools using through the three horizontal lines icon on top right hand corner:
When you have the developer tools opened have the console tab active. You can debug your index.html from the Sources section of the developer tools.
In Chrome you can do this by clicking Sources and then choosing the index page as the image below illustrates:
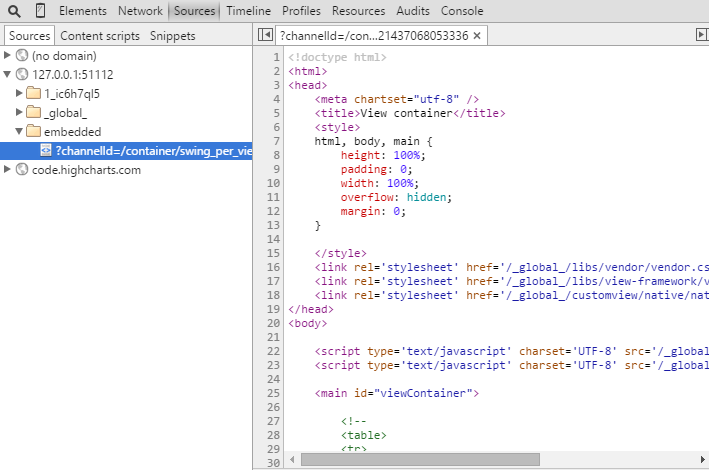
Simply click on the line number to add the breakpoint and then refresh the page to start debugging.
Step 2: Editing view
The next step is to edit the view itself. In the View designer click your “Highcharts - Bar” and then click “Edit view” button.
In this example, we would modify both manifest.json and index.html.
Manifest.json
Let’s start by modifying the manifest.json to have a correct measure and split configuration.
This view will only support measures by numeric fields and splits by text fields only.
In the View designer, click manifest.json.
Measure
Let’s add the validFieldTypes restriction to the measures option already defined in default manifest.json.
For more information see here in regards to different options available.
Before:
...
"measures": {
  "displayName": "Measure",
  "type": "MEASURE",
  "mandatory": true
},
...
After making the changes:
...
"measure": {
  "displayName": "Measure",
  "type": "MEASURE",
  "mandatory": true,
  "validFieldTypes": [
    "NUMBER"
  ]
},
...
Split
Let’s add the validFieldTypes restriction to the split option as well, but we will also make
the split option mandatory. Making an option mandatory means that the a user must split by something.
For more information see here in regards to different options available.
Before:
...
"split": {
  "displayName": "Split",
  "type": "GROUPING"
}
...
After making the changes:
...
"split": {
  "displayName": "Split",
  "type": "GROUPING",
  "mandatory": true,
  "validFieldTypes": [
    "TEXT"
  ]
}
...
By default the measure and split are already included in the toolbar in the default manifest.json. You can see this as the entries for both splits and measures are added to the “structure” property appropriately.
NOTE: Visokio has certain common internal names to mean measures, splits etc. See Options and definitions for more information.
Save the file once you have made the changes.
Index.html
The next step is to edit the index.html. Click on “index.html” in the View designer to edit it.
In this file we will write all the logic of actually showing the Highcharts bar view.
Let’s start by adding the Highcharts libraries in the appropriate section in the head section.
...
<!-- Put SCRIPT tags to load 3rd party libraries here -->
<script src="http://code.highcharts.com/adapters/standalone-framework.js"></script>
<script src="http://code.highcharts.com/highcharts.js"></script>
...
Lets remove the following from the index.html as we would be doing our own click handling and selection.
...
// Ensure clicks on unoccupied space clear the selection in Omniscope, and close menus:
document.body.addEventListener("click", function() {
    omniscope.view.whitespaceClick();
});
...
Next step, is to replace setting of the text content of the “main” HTML element with the view implementation. This involves first replacing the lines near the bottom of the index.html page with a call to render function which we will define below.
...
// Naively redraw on any of these events
// (load = first init, update = external settings/state change, resize = browser window resized)
omniscope.view.on(["load", "update", "resize"], function() {

    // Retrieve the auto-query results, a 2d array ([row][column]):
    var data = omniscope.view.context().result.data.records;

    document.getElementById("main").textContent = JSON.stringify(data, null, 2);
});
...
With the following:
// Naively redraw on any of these events
// (load = first init, update = external settings/state change, resize = browser window resized)
omniscope.view.on(["load", "update", "resize"], function() {
  // It is good practice to ensure you handle errors and handle them appropriately.
  try {
      // Notify the container that the view is busy loading
      omniscope.view.busy(true);

      // Call the render method to display the data.
      renderView(omniscope.view.context().result.data);

  } catch (error) {
      throw new Error(error.message);
  } finally {
      // Notify the container view is now ready.
      omniscope.view.busy(false);
  }
});
...
The above will ensure that every time there is “load”, “update” and “resize” events renderView function is called with the results of the auto-query/auto-paning.
Finally let’s add the render function itself. Add the following in the script tag in the body.
<script>
// Using the query results show it in the custom visualisation.
function renderView(queryResultData) {


    // CREATE SPLIT LABELS.
    var labels = [];

    // Note the result is a 2d array - for more information see Query API docs.
    for (var i = 0; i < queryResultData.records.length; i++) {
        labels.push(queryResultData.records[i][0]);
    }

    // Get stored measure option
    var measure = omniscope.view.context().options.items.measures;

    var yAxisLabel = "";

    // RECORD COUNT option doesn't have an input field associated with it
    // hence we are checking to see if the input field is present.
    if (!measure.inputField) {
        yAxisLabel = measure.function;
    } else {
        yAxisLabel = measure.inputField + " (" + measure.function+")";
    }
    var bodyOffsets = document.body.getBoundingClientRect();

    // High chart specific
    new Highcharts.Chart({

        chart: {
            renderTo: 'main',
            width: bodyOffsets.width,
            height: bodyOffsets.height,
            events: {
                click: function() {
                    /*

                      Whitespace click handling

                    */
                    // On clicking anywhere on the chart other than point
                    // trigger whitespace click.
                    omniscope.view.whitespaceClick();
                }
            },
            type: "column"
        },

        title: {
            text: null
        },

        xAxis: {
            gridLineWidth: 1,
            categories: labels,
            type: "categories",
        },
        yAxis: {
            gridLineDashStyle: 'longdash',
            title: {
                text: yAxisLabel
            }
        },
        plotOptions: {

            series: {
                animation: 1000,
                allowPointSelect: true,
                dataLabels: {
                    enabled: true
                },
                states: {
                    select: {
                        color: 'blue'
                    }
                },
                point: {
                    events: {
                        click: function() {

                            /*
                            Selection handling
                            */
                            // On clicking a bar trigger omniscope selection.
                            var fieldName = omniscope.view.context().options.items["split"].inputField;
                            var selectedValue = this.category;

                            var filter = {
                                "type": "AND",
                                "filters": [{
                                    "type": "FIELD_VALUE",
                                    "inputField": fieldName,
                                    "operator": "=",
                                    "value": selectedValue
                                }]
                            };

                            omniscope.view.context().viewSelection = { filter: filter };
                            omniscope.view.updated();
                        }
                    }
                }
            }
        },
        legend: {
            enabled: false
        },


        series: [{

            /*
            Sending data to chart
            */
            data: queryResultData.records // putting the query results.
        }]
    });
}
</script>
...
NOTE: How the selection and whitespace clicking is also implemented using Highcharts API.
Step 3 Viewing
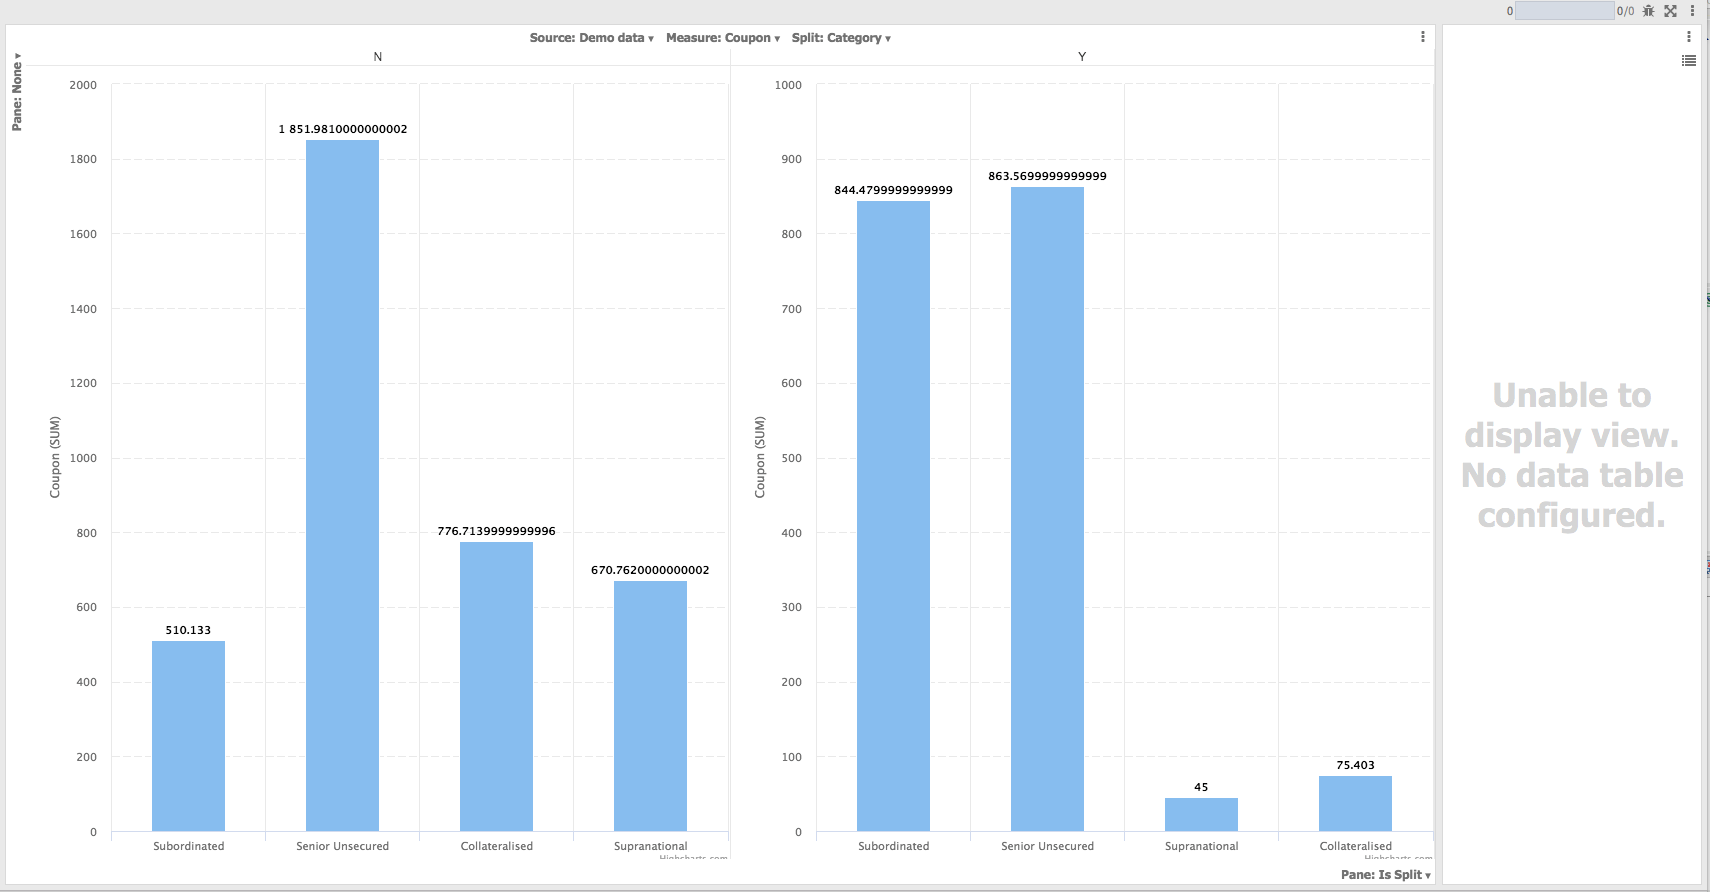
If you haven’t already done so, add the view from the Add view menu and you should see your Highcharts bar view.
The view itself is ready for paning automatically, if you were to configure Pane X or Pane Y you should see it auto-paning taking effect.
You can even view your in Mobile interface you do not have to do anything special, and if you were to change your Web sharing settings (Settings > Web sharing) you can even see your View on your tablet.
The view would automatically be available in Mobile interface automatically, you don’t have to do anything more.
If you turn on your Desktop sharing settings, you should be able view the same view on your tablet too.
Summary
This tutorial shows how to create your Bar view using high charts where you didn’t have to execute your own queries we simply read the query results directly from the context object itself. The paning was done for us automatically too and we didn’t have to worry about implementing paning logic.