Basic View Concepts
These are core concepts not only to Custom Views but also to Views in Omniscope. They are required for each of the following sections in Concepts.
Split
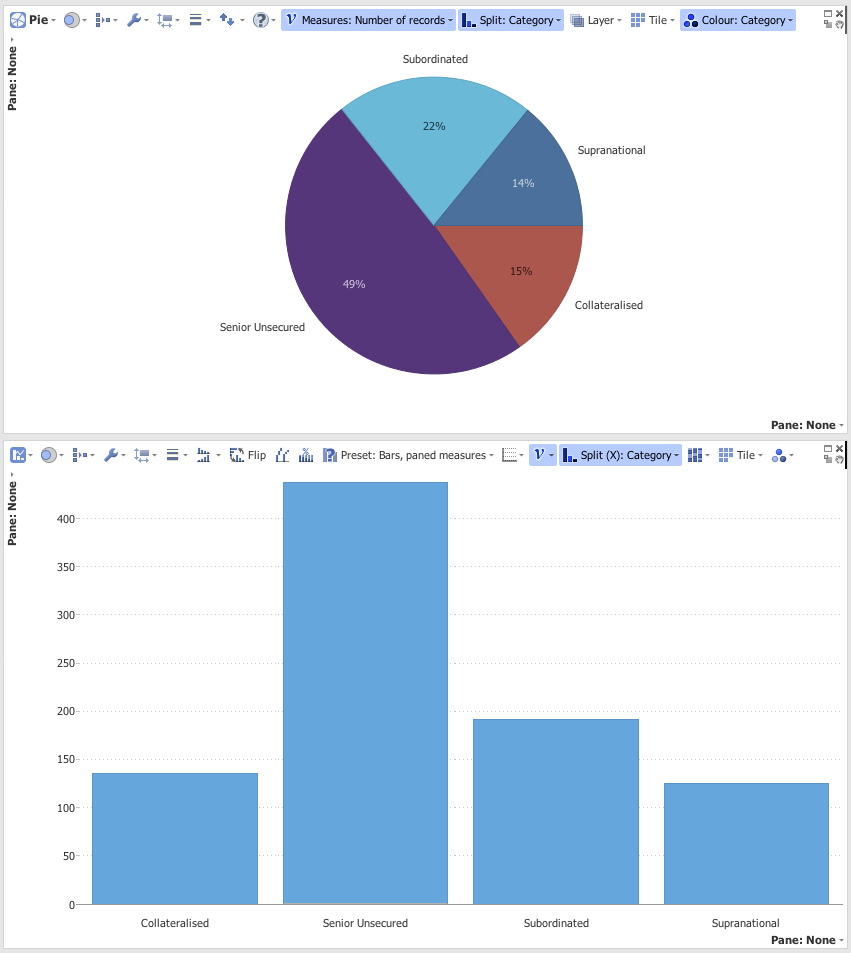
Split dictates how the view buckets the data for individual components. For example, in Pie View split dictates what a single segment of Pie is. In Bar and Line View split dictates what a single Bar or X value of a line is.
Below is an image showing a Pie and Bar view both Split by the Field ‘Category’ using the Bond Prices data set.
Paning
Paning allows the same chart to be reproduced across different buckets of the data with ease.
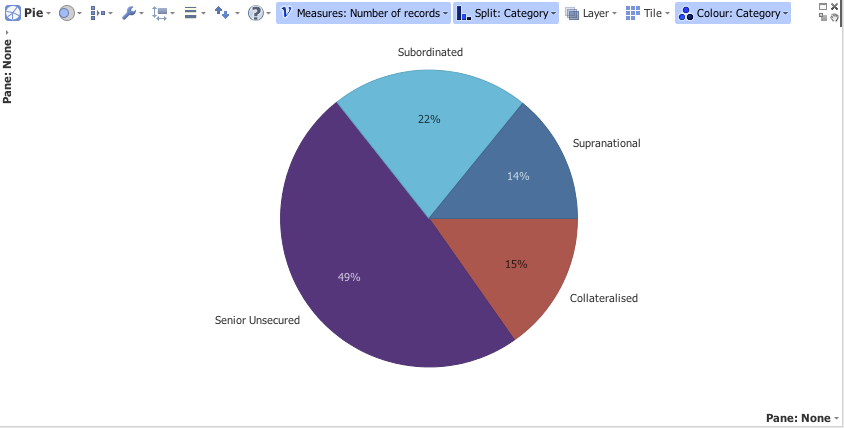
Consider this example using the Bond Prices data set, and create a Pie chart with a Split along Category. Without paning this looks like:
We will first add X-Paning, this will add new charts horizontally based upon the ‘Is Snk’ field values. This will split the data into two ‘buckets’ for ‘Y’ and ‘N’ values. This results in the following two pie charts for each bucket:
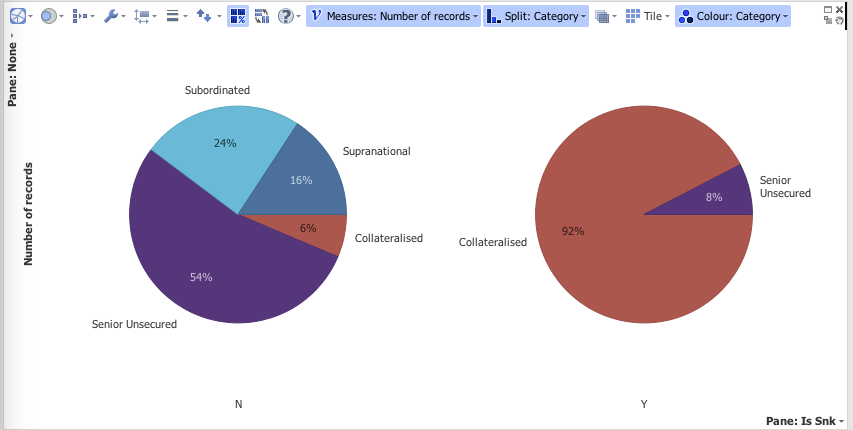
This leads to different proportions, as there are no ‘Subordinated’ or ‘Senior Unsecured’ bonds where ‘Is Snk’ is true. So paning allows the user to see how the data changes in different subsets.
We can now add some Y-Paning, choosing a different field which will ad new charts vertically. Doing this for the field ‘Is Split’ provides the following result:
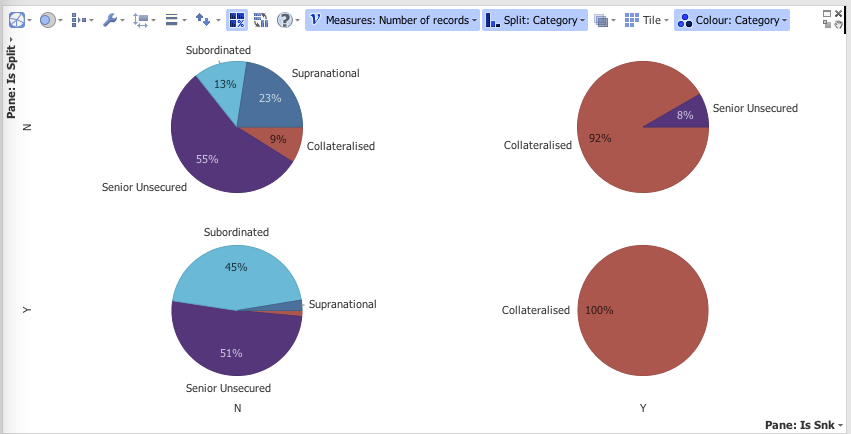
This effectively gives us a grid view, with the top left Pie View representing data where both ‘Is Split’ and ‘Is Snk’ is ‘N’, the bottom right is where both ‘Is Split’ and ‘Is Snk’ is ‘Y’.
Notice that throughout the charts share the same options, such as colors, split, and measures.
Every Custom View panes by default, as Auto-Paning is set up by default in the manifest.json. There is more information on Auto-Paning here
Selection
Selection is a way of viewing a subset of data in a view so that you can:
-
Execute “Move” or “Keep” commands to remove or isolate the selected data.
-
Trigger Brushing in other views.
Selection is performed when a data point is clicked or dragged over with the mouse/touch interface. For example by selecting the area on the chart which includes these columns will highlight this data set.
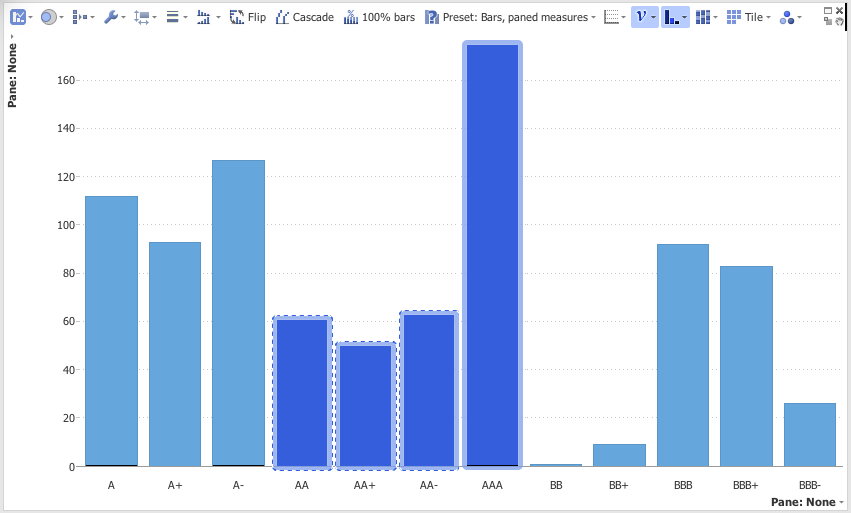
Clicking on an area with no data points will remove the selection, this is known as Whitespace Click.
There is more information on how to implement selection in your Custom View here, more information on Whitespace Click is here.
Brushing
Brushing shows the effect of a selection in another view. There are two kinds of brushing, ‘Poor Man’s’ and ‘Advanced’, here we will give an example of advanced brushing. Say that the example performed in the previous subsection led caused the selected data to be filtered. This would lead to the other view to grey out the data that was not selected.
The image below shows this being executed:
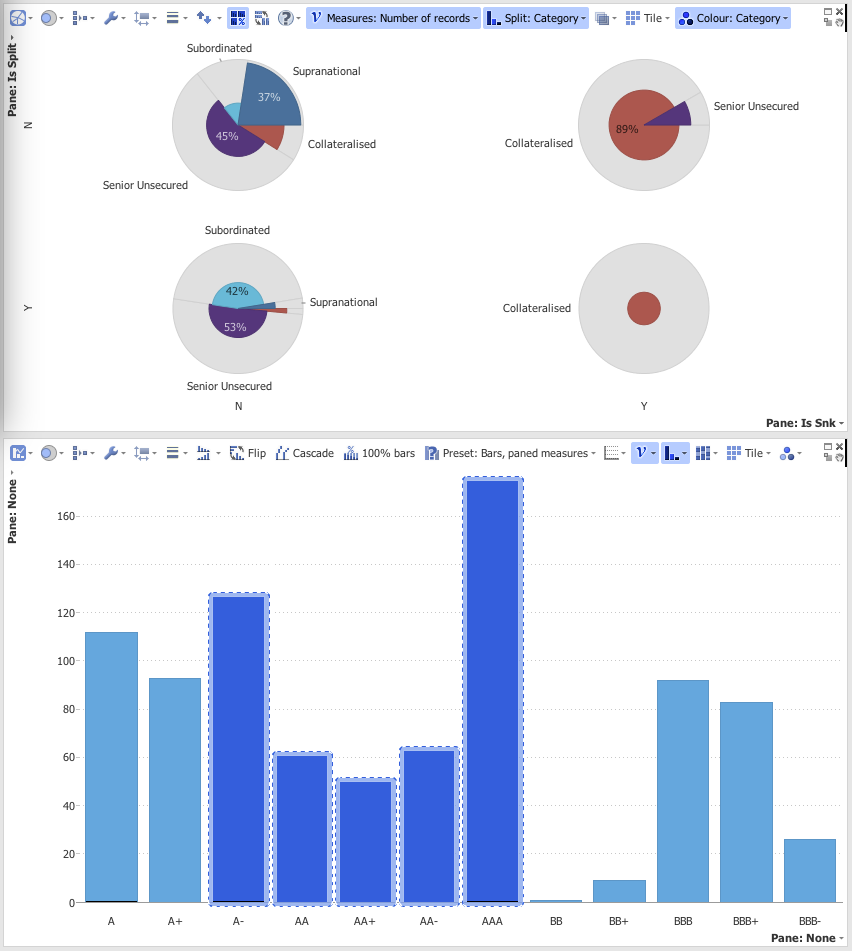
This is known as advanced brushing, there is also a ‘Poor Man’s’ brushing which will only plot the selected data. There is more information on how to implement this in your Custom View here