Manual Querying with Auto-Paning
This tutorial will show how a create manual query for a view in the index.html file while still allowing paning to be set in data explorer. We will use the Highcharts Bar example from a previous tutorial to do this.
The views measures and split will now only be changed in the view designer not in data manager, this is set inside a JSON object which matches the schema of QueryApi.SimpleQuery. We will then insert the each panes filter to the query from the view context
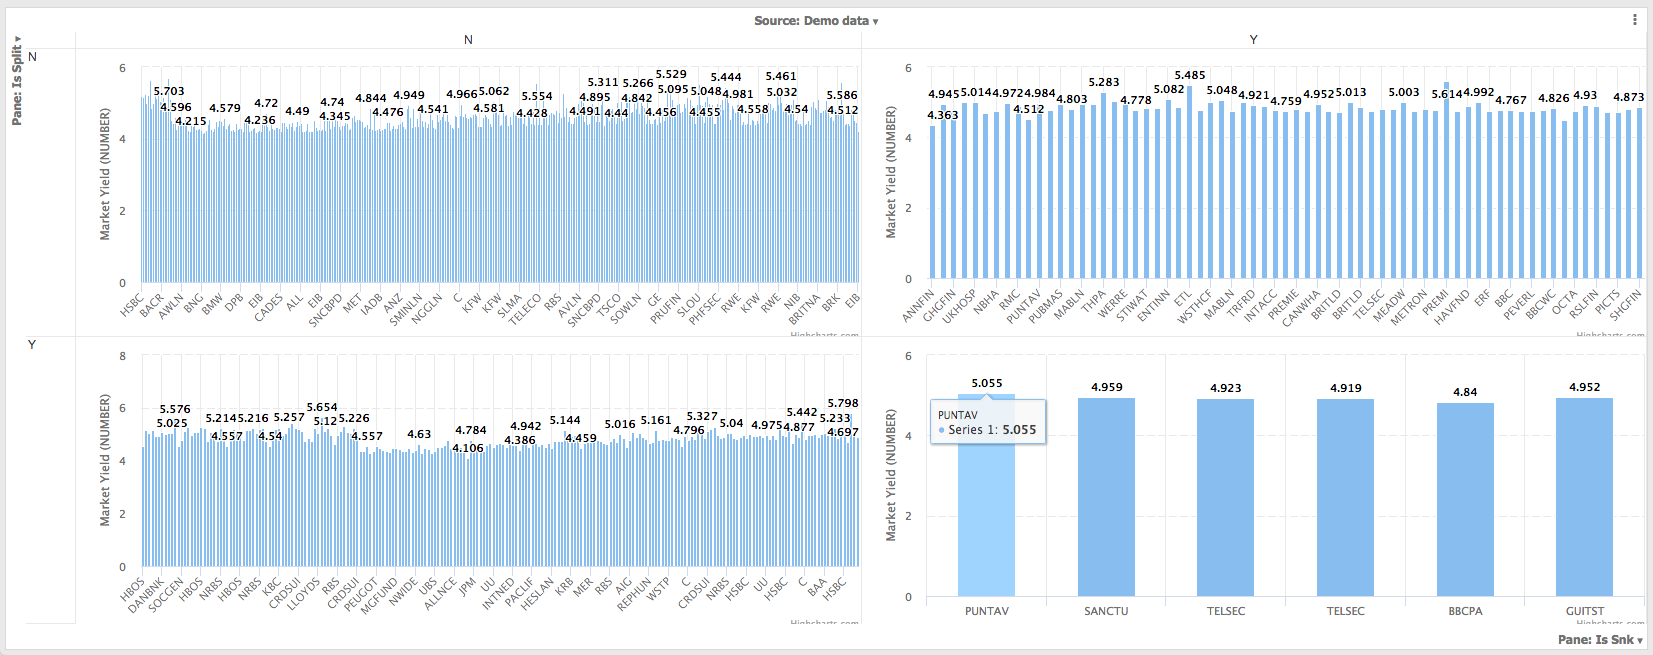
The above image shows the constructed view with paning. Note that there are no options for split or measures. This is because they are now stated in the query created in the index.html
Creating the manual query
A manual query is created as a JSON variable inside the inside the script tags. Here is an example of one such query for the Bond Prices demo data set:
var query = {
// Select the fields you want
  "fields": [
    "Ticker",
    "Market Yield"
  ],
  // Add some filters
  "filter": {
  // If the type is equal to AND then the union of each of the filters will be selected
    "type": "AND",

    // Each of the filters are defined here
    "filters": [

      // Only rows with a Coupon of 1.5 or greater
      {
        "inputField": "Coupon",
        "operator": ">=",
        "value": 1.5
      },

      // The Issue Name cannot be null
      {
        "inputField": "Issue Name",
        "operator": "!=",
        "value": null
      },

      // Only A grade bonds
      {
        "inputField": "Composite Rating",
        "operator": "IN",
        "values": [
          "A",
          "A-",
          "A+",
          "AA",
          "AA+",
          "AA-",
          "AAA"
        ]
      },
      // Exclude all bonds where the composite rating is MIDDLE EAST or EUROPE
      {
        "type": "NOT",
        "filter": {
          "type": "OR",
          "filters": [
            {
              "inputField": "Composite Rating",
              "value": "MIDDLE EAST"
            },
            {
              "inputField": "Composite Rating",
              "value": "EUROPE"
            }
          ]
        }
      }
    ]
  }
}
Only doing this will enable you to create a view like the one below, however it will be the same across all panes as the query does not currently consider each individual panes filter.
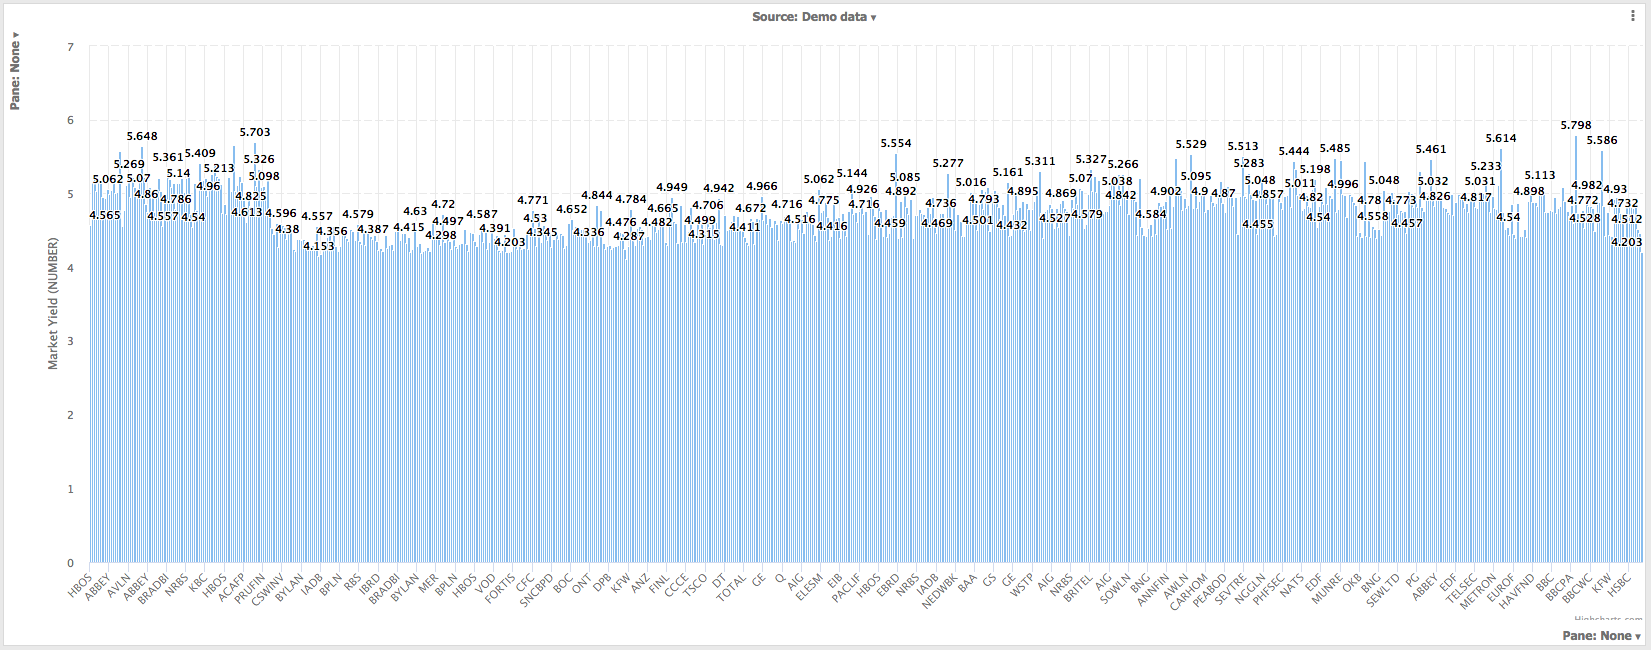
This query should be created on the events load, update and resize when the view is rendered. It is at this point that
we will access the view context to get the panes filter, appending it to the query variable. Below we show how this is done in the index.html, before rendering the view with renderView.
    // Naively redraw on any of these events
    // (load = first init, update = external settings/state change, resize = browser window resized)
    omniscope.view.on(["load", "update", "resize"], function() {

        // It is good practice to ensure you handle errors and handle them appropriately.
        try {

          // Create the query this must be done inside this try
          // var query = ... (see above section of code

          // Get the filter for each pane
          var paneFilter = omniscope.view.context().dataConfig.filter;

         // If paning is not selected, then paneFilter will be null
        if (paneFilter != null) {

          // Push the panes filter to the query.
          query.filter.filters.push(paneFilter);

        }


            // Notify the container that the view is busy loading
            omniscope.view.busy(true);

            // Get the view endpoint using the Custom View API, this is needed to create the query builder.
            var endpoint = omniscope.view.endpoint();

            // Execute the query and render the view.
            omniscope.query.builder(endpoint).table(query).on("load", renderView).execute();


            // Call the render method to display the data.
            // renderView(omniscope.view.context().result.data);

        } catch (error) {

            throw new Error(error.message);

        } finally {

            // Notify the container view is now ready.
            omniscope.view.busy(false);
        }
    });
Accessing the data from the query result
renderView is handed the query result, has a slightly different schematic to the data in the view context result data which was used in the previous tutorial. Additionally the way in which the views measures and splits are set has changed, and so they need to be accessed through the query result instead of the view context. These changes requires renderView to be slightly modified.
Note that render view refers to the query result as queryResultData, we will only need to access the data field from the resulting JSON. This JSON object has a QueryApi.TableQueryOutput schematic that is detailed here.
The first change we make is to add this line of code to select the data field:
// We will only need to access the data from the querey
      queryResultData = queryResultData.data;
As we now set the measures we are using for the chart in the query, we should access the schema that can be found in the query result to set the y axis title. This is done as so:
      // Get stored measure option
      var measure = queryResultData.schema.fields[1];

      // Set the y axis label
      var yAxisLabel = measure.name + " (" + measure.type +")";